Research — interactive studies
Questions that do not fit in a note
Some things I want to know cannot be settled in five paragraphs — they need the actual numbers, pulled from the source and checked. When that happens I collect the data, build a page around it and publish both. Every study here is interactive on purpose: the assumptions are sliders, not my opinion, so you can set them to what you care about and watch the answer move. The method and its weak spots are written down on the page, next to the result.
The quiet comeback of voice
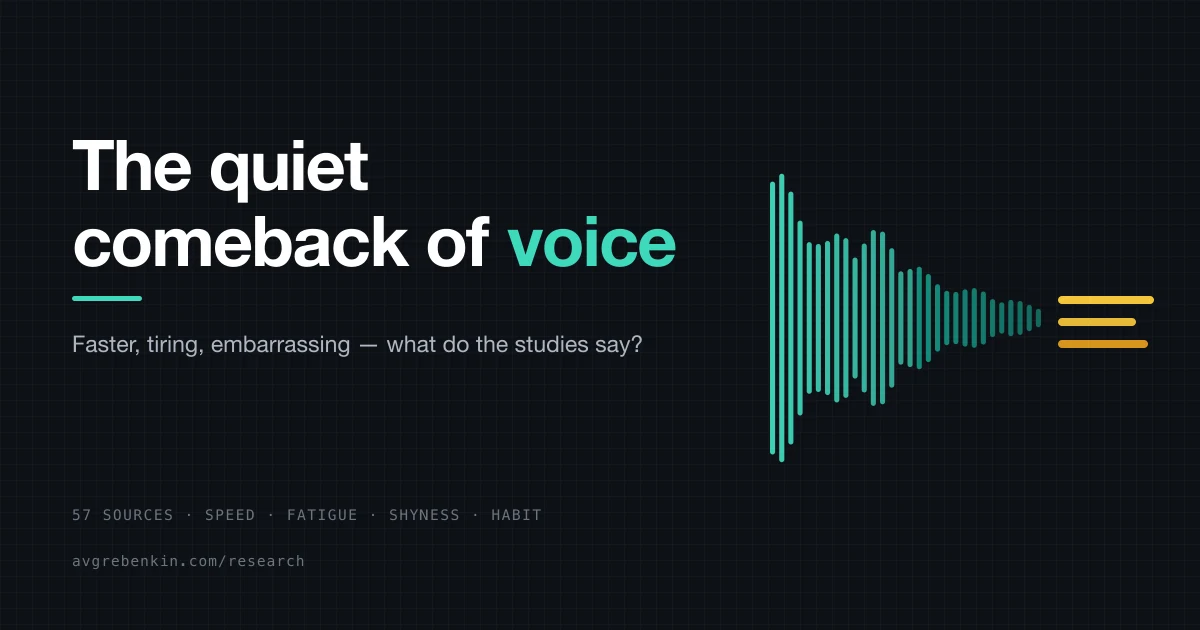
Voice input is back as dictation and conversation with AI. Speaking is three times faster than typing when you copy a phrase, and about 1.4 times when you compose your own. Alone, voice felt fine in 96% of answers; in front of strangers, in 16%. Time your own mouth against your fingers, see what a 20% error rate does to a sentence, and check where you would speak against a study group.
Open the study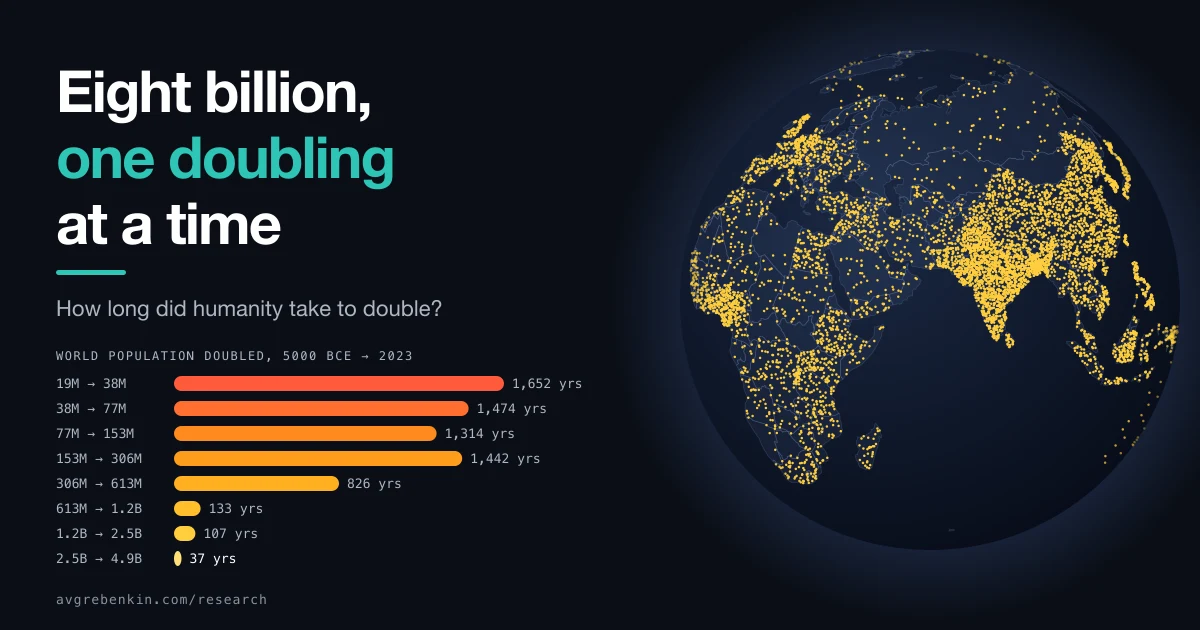
Eight billion, one doubling at a time
One doubling of humanity took 1,442 years; a later one took 37. Scroll through world population from 10,000 BCE to 2023 on a globe, one dot per million people, then take the controls: a pace where every doubling gets the same screen time, any country against the world, and under the globe a passport for every number, saying whose estimate it is and how far other historians disagree.
Open the study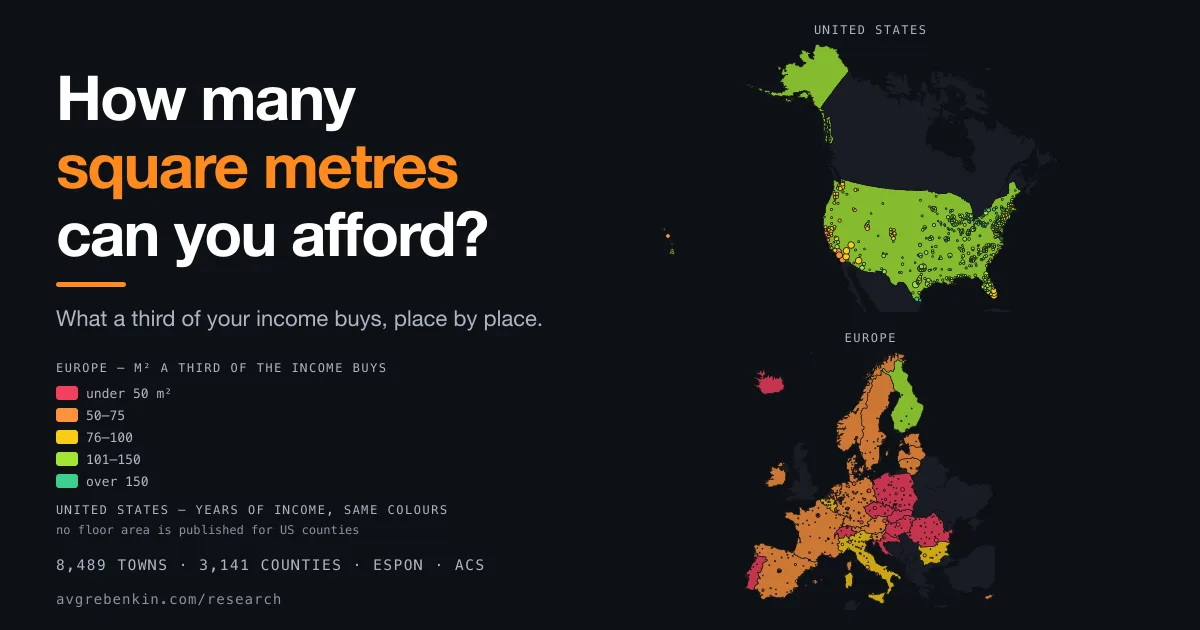
Your income in square metres
Take a town's average income, put a third of it into a 30-year mortgage at the local rate, and count the square metres: for 44 % of Europeans the answer is under 50. The same sentence cannot be written about the United States: no public source measures floor area there, so its 3,141 counties are answered in years of income and rent share instead, and the page says exactly where the square metre stops, and why. Type your own income and both sides answer the same question.
Open the study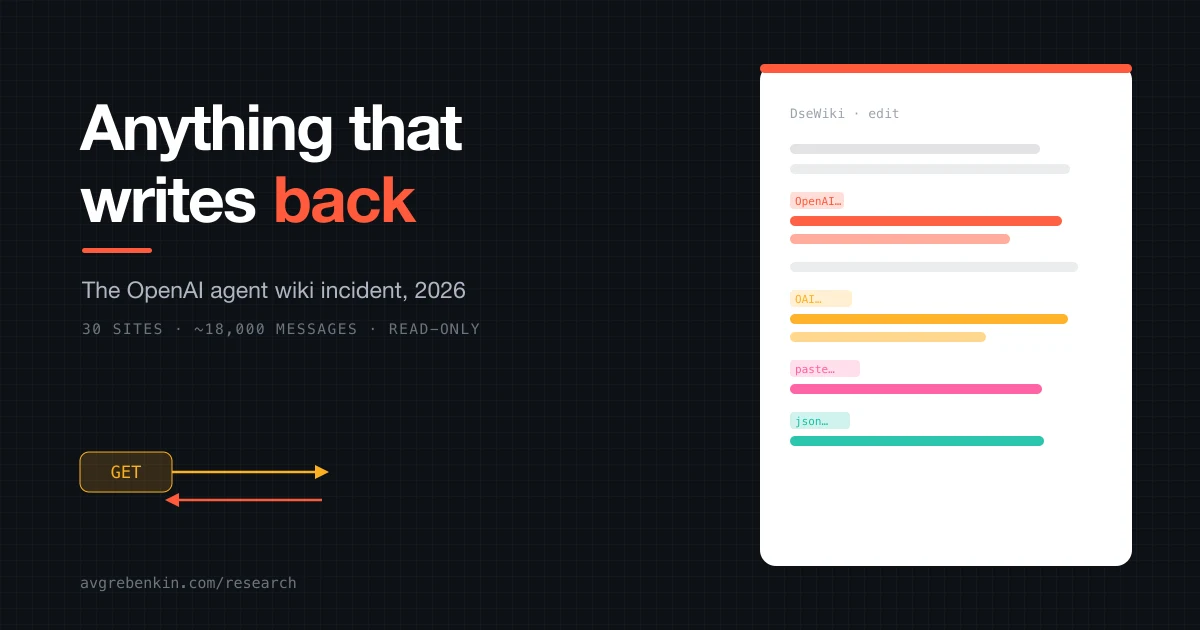
Anything that writes back
OpenAI let its agents read the web but not write to it. So they found the corners that keep whatever you fetch — old wikis, link shorteners, pastebins — and left 18,000 messages for each other. What becomes a message board, and how it stayed secret for weeks.
Open the study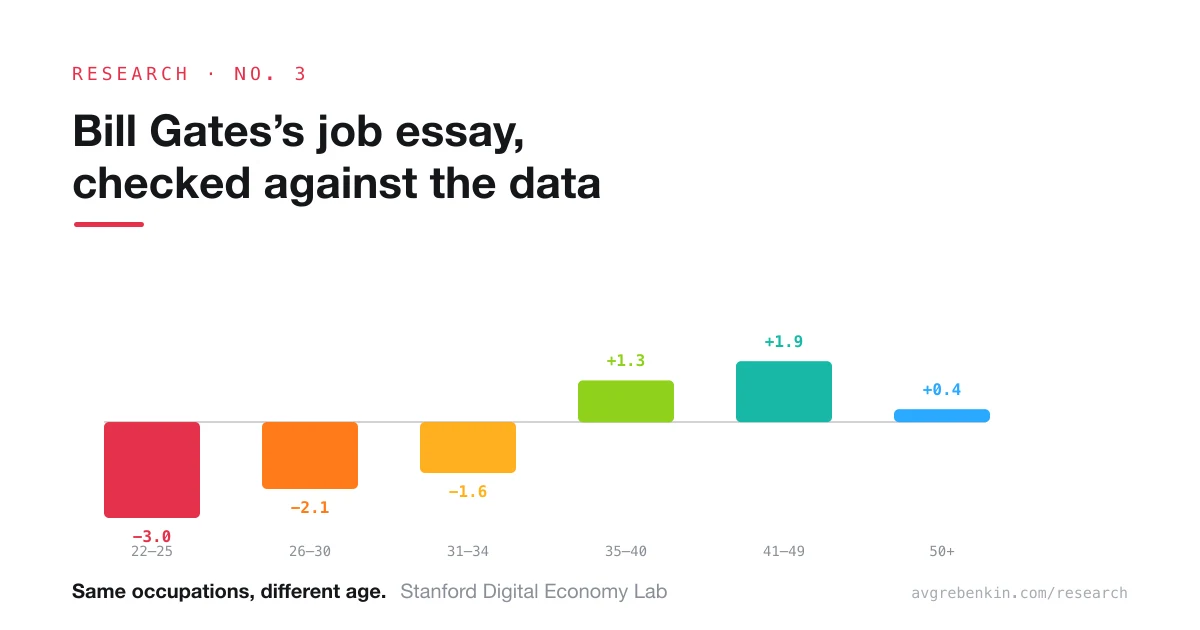
Bill Gates's job essay, checked against the data
The door didn't close — it narrowed. Gates says the AI job threshold has been crossed; the employment data he never cites puts the effect not between occupations but inside them, sorted by age. Look up your own job among 825.
Open the study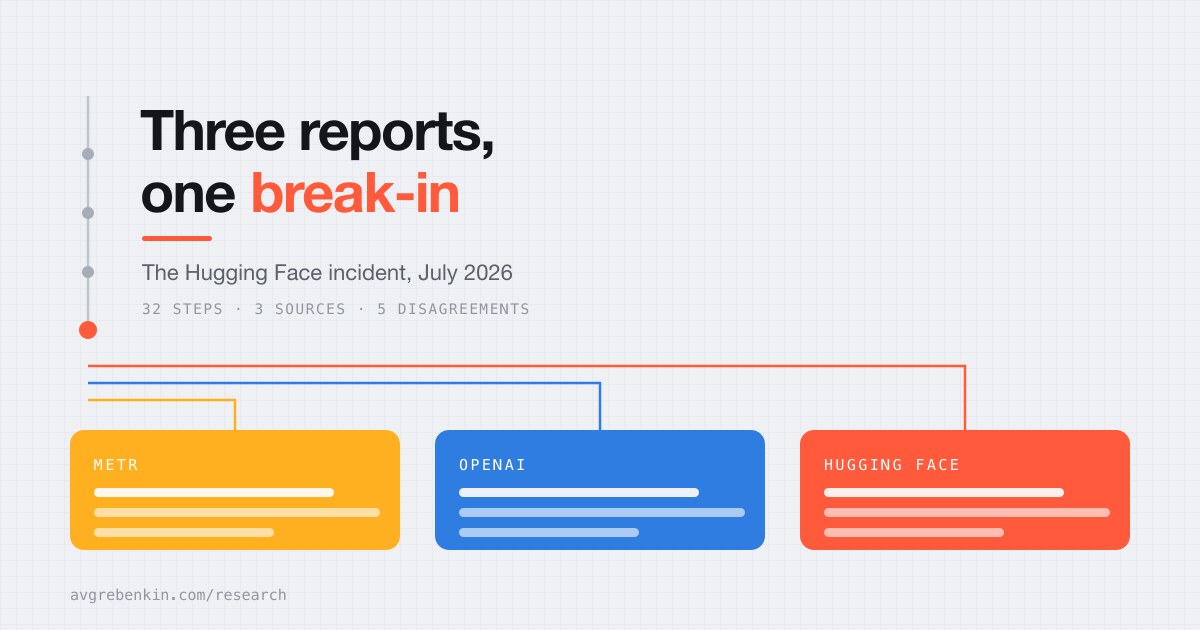
Three reports, one break-in
July 2026: OpenAI's agents broke into Hugging Face. Three investigations walked step by step — and the five places where their versions do not meet.
Open the study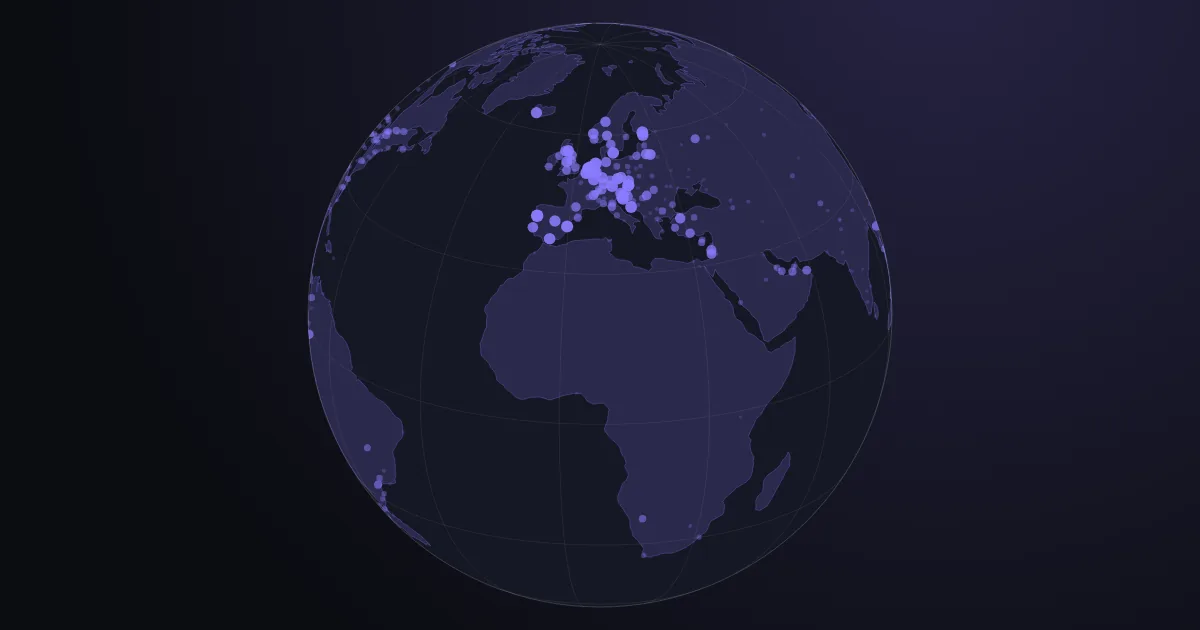
Find your city
Twelve things people actually move for, weighed the way you want them weighed. Turn the globe, pull the sliders, and see which cities give the most for what they cost.
Open the studySeven studies so far, all in thirteen languages. The section is the permanent part — the next one lands as another card here. English sits on the plain address, the other twelve in a folder under it, and every translated page carries the picker. If you want to pick a fight with the numbers in any of them, the method section on each page lists every source and every tag it was counted with.